Please verify your VPN Status
The resources on this page may require permission and the use of the UMBC VPN to access. See the FAQ on getting connected for more information. You will need to request access before using any of these tools.
Student Success
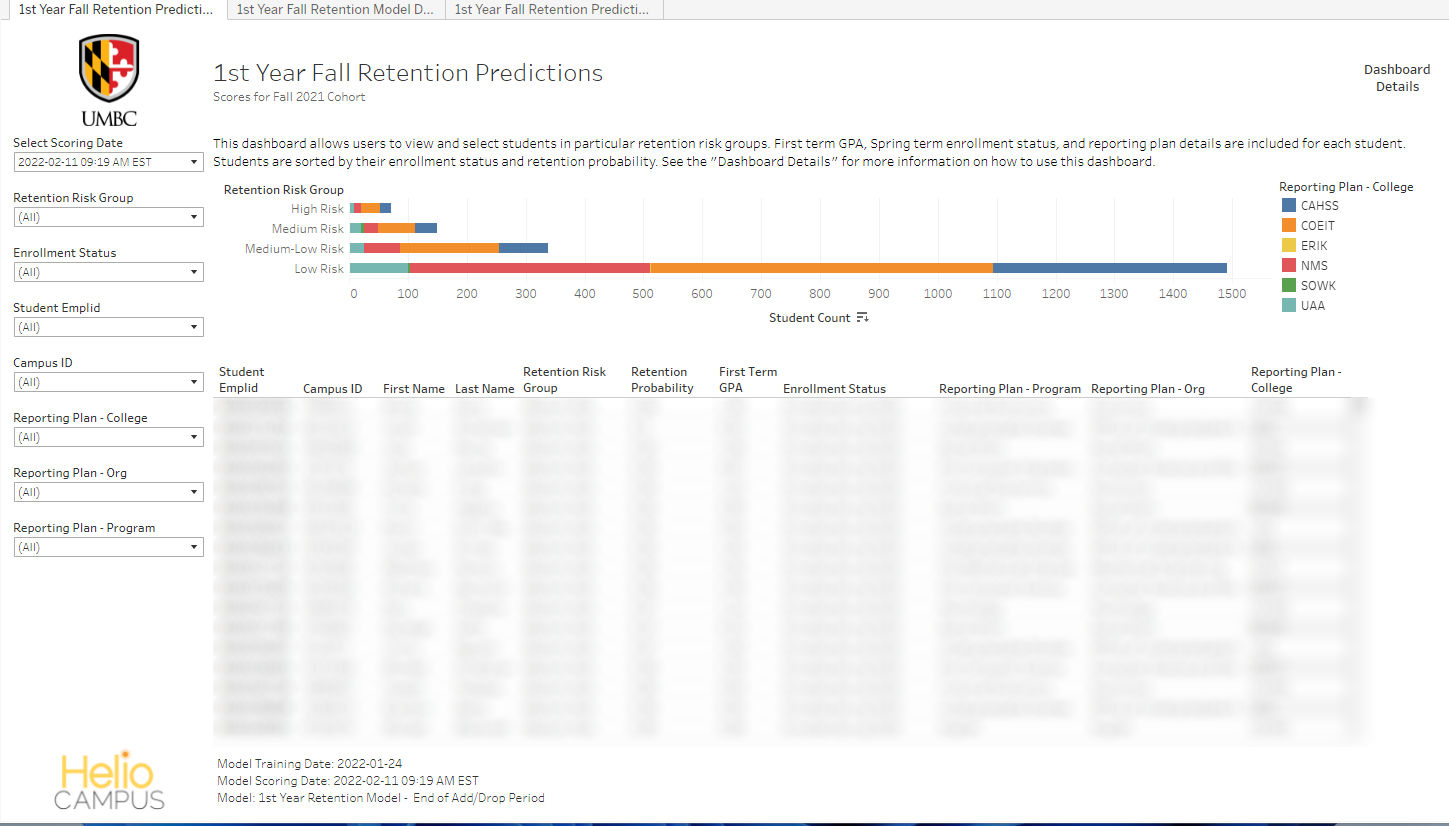
Fall 2021 Retention Predictions
The retention model is a First-time Full-time Freshmen retention model looking at the end of the student’s first Fall term with retention into their second Fall term.
The model was trained using Fall 2018, Fall 2019, and Fall 2020 Freshman cohorts. Predictions are currently available for the Fall 2021 Freshmen cohort.
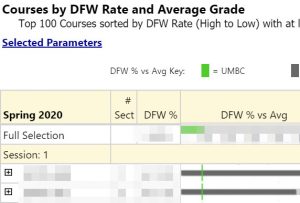
Courses by DFW Rate and Average Grade
This popular report helps you to understand the proportion of DFW (D, F, W grades) earned in courses.
Learn More
This report allows exploration of various parameters related to courses.
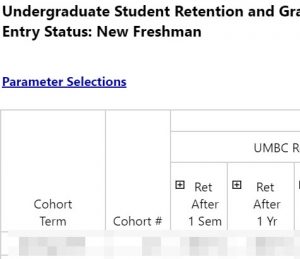
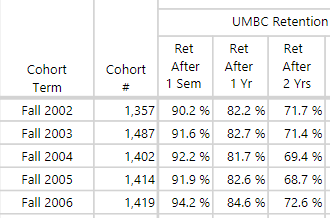
Undergraduate Student Retention and Graduation Rates by Plan
Learn More
This key and critical report allows you to explore retention and graduation rates by cohort, and see counts by a variety of demographic factors.
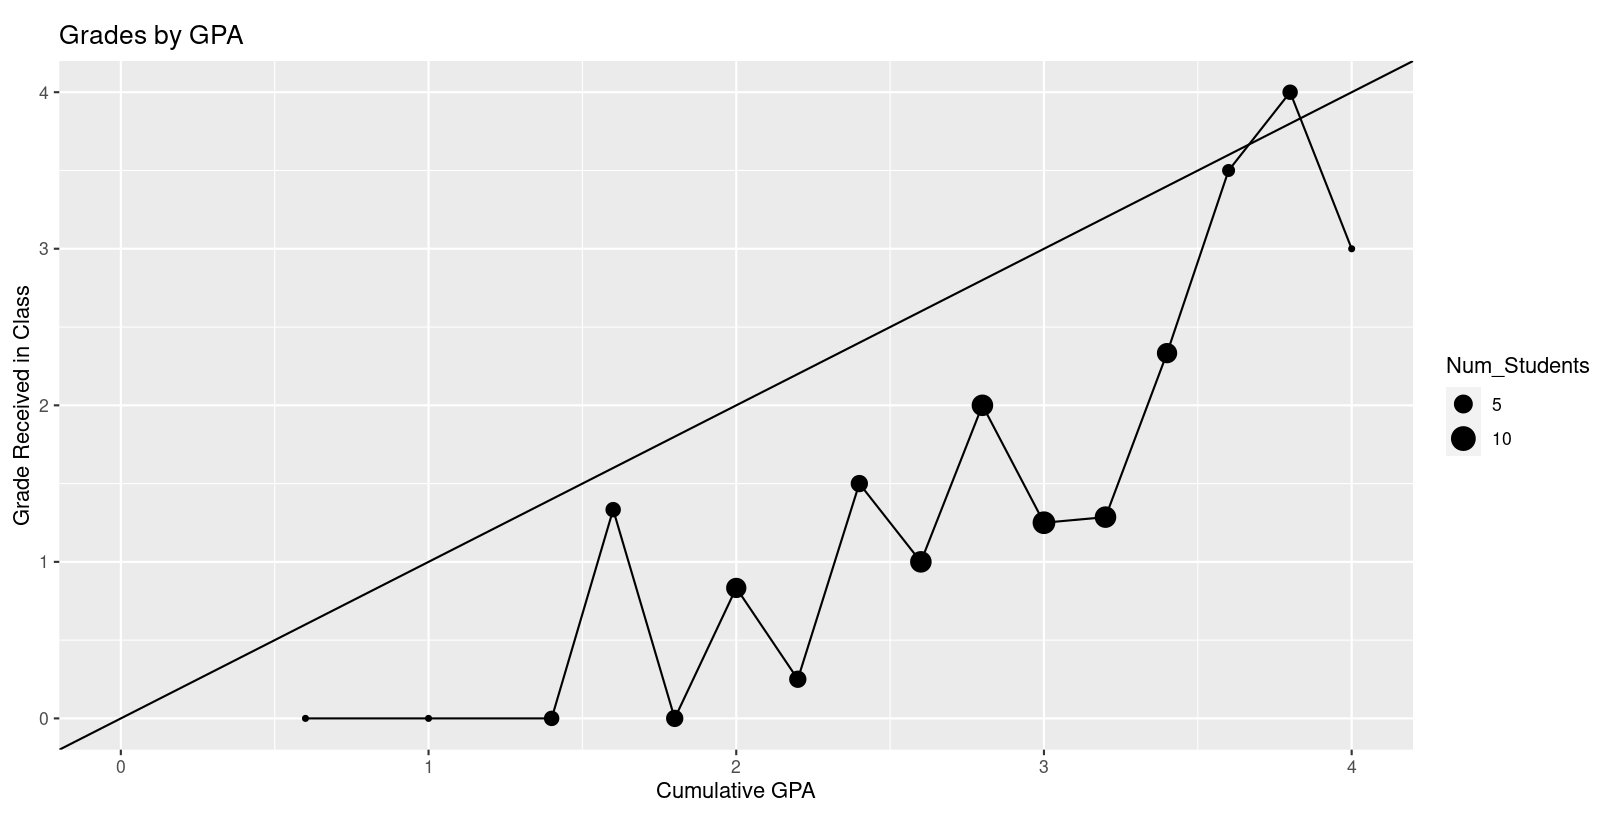
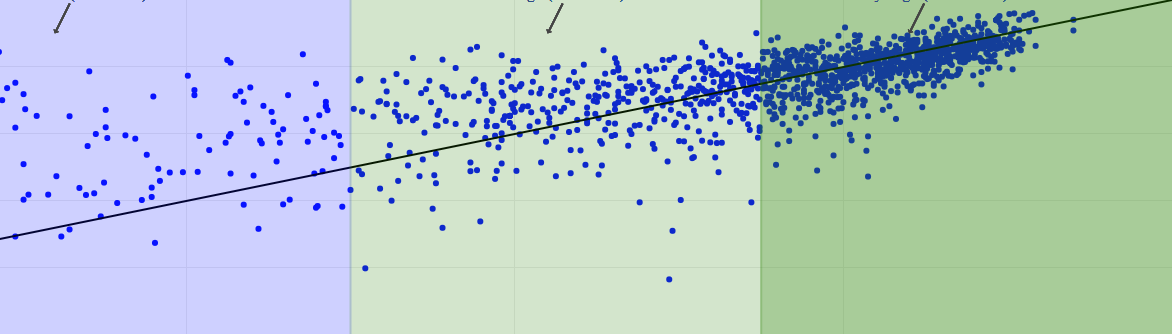
Grade Surprise
Learn More
This tool shows how student performance in a particular class deviates from student cumulative GPA. The diagonal line represents the expected outcome in a course given a student’s cumulative GPA at the time of enrollment.
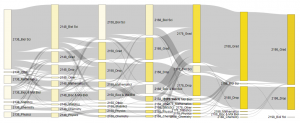
Sankey Major Migration
Learn More
This tool allows users to choose Sankey diagrams that show the progression of students through and between majors, towards graduation, and who leave (drop) UMBC. The tool is most useful in understanding general patterns of students’ movement and to where they move (migrate).
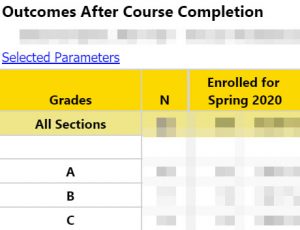
Outcomes after Course Completion
Shows how a grade earned in one course is associated with a grade in a second, user-defined course.
Learn More
Graduation & Time to Degree
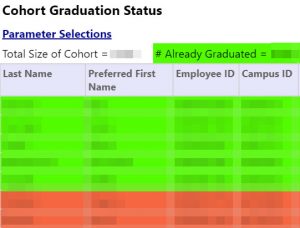
Cohort Graduation Status
This student-level report provides a list by cohort and regarding who has graduated, is still enrolled, or has stopped out.
Learn More
This is a fine-grained tool to understand the graduation rates and success by cohort and may be helpful to identify students in need of support and outreach.
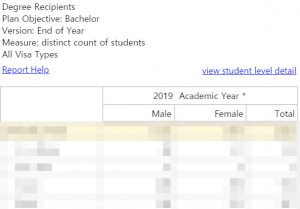
Degree Recipients
Provides information on the key performance indicator of degrees awarded
Learn More
This report gives you the official counts of degree recipients by a variety of methods including ethnicity, college, and more.
6-Year Graduation Prediction Model
This tool presents the output of a predictive model that generates the probability that a student admitted as a freshman admits will graduate in 6 years using data through their third semester at UMBC.
Learn More
It is most useful for student success staff and advising and planning. Important warning to users: this model is not solely designed to identify students at academic risk. For example, students with very high GPAs who complete twelve credit hours per term will be identified as having low 6-year graduation probabilities. (Current modeled cohort: Fall 2019)
4-Year Transfer Student Graduation Prediction Model
This tool presents the output of a predictive model that generates the probability that a student admitted as a transfer student with more than 30 credits will graduate in 4 years from their admittance using data through their second semester at UMBC.
Learn More
It is most useful for student success staff and advising and planning. Important warning to users: this model is not solely designed to identify students at academic risk.